
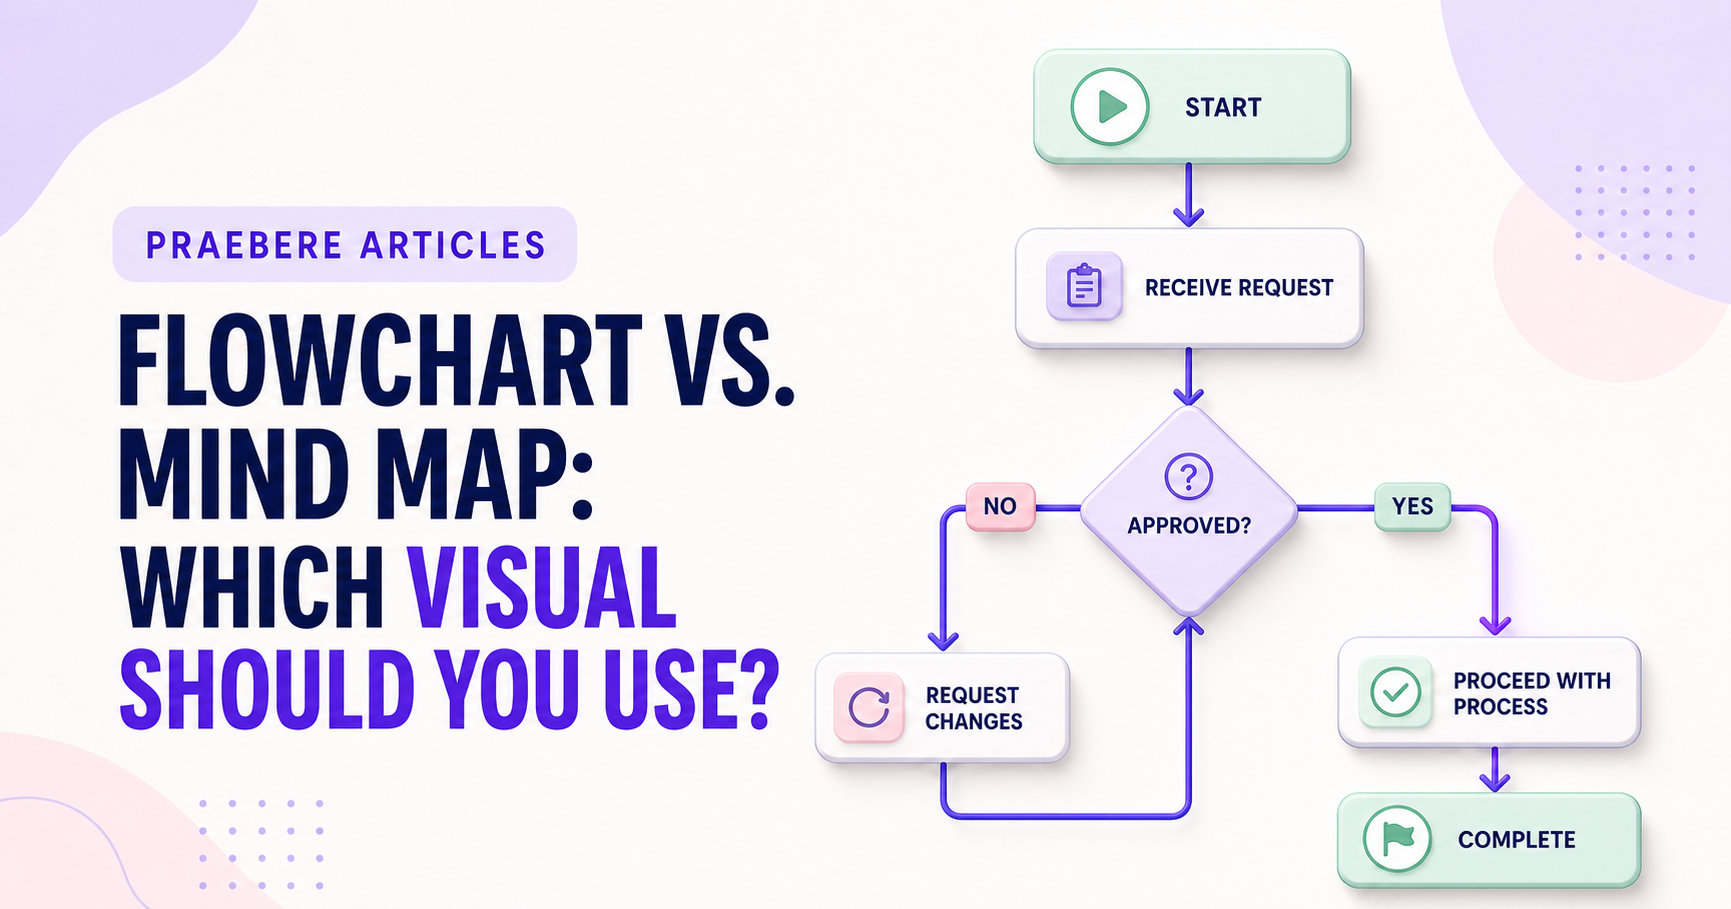
The right choice depends on the job
The value of “Flowchart vs. Mind Map: Which Visual Should You Use” becomes clearer when attention shifts to “The two formats answer different questions.” Translate the communication goal into an audience action: understand, compare, decide, remember, or perform.
The practical challenge begins when general advice meets real content, real constraints, and a real audience. What question should the data answer, and could the chosen scale or comparison lead viewers toward the wrong conclusion? Which definitions, baselines, filters, and uncertainties must remain visible before the audience can act on the pattern? The sections ahead use these questions to move from the central idea to concrete decisions, technical criteria, and an applied example.
The two formats answer different questions
A flowchart explains what happens, in which order, and under which conditions. A mind map explores how ideas relate to a central topic. One emphasizes movement through a process; the other emphasizes association and expansion.
Both use nodes and connections, but the meaning of those connections differs. A flowchart arrow usually indicates direction, while a mind-map branch usually indicates membership or association.
Choose a flowchart for sequence and decisions
Use a flowchart for procedures, approval paths, troubleshooting, algorithms, customer journeys, and any explanation with a beginning, steps, branches, and an outcome. Its defined reading path makes it suitable for testing whether a process is complete.
The structure becomes less effective when the goal is free exploration. Forcing early ideas into decisions and ordered steps can hide useful associations before they are understood.
Choose a mind map for exploration and categorization
Mind maps work well for brainstorming, note organization, topic outlines, vocabulary, and early planning. They allow several branches to develop without requiring one correct reading order.
They are less precise for operational instructions because branches do not normally define timing, conditions, or handoffs. A reader may understand the topics but still not know what to do next.
Use the formats at different stages of the same project
A mind map can collect ideas and identify categories. Once the goal and relationships are clear, a flowchart can turn selected ideas into a process or narrative sequence. Moving between formats is often more useful than trying to make one diagram do both jobs.
Praebere is centered on connected visual sequences and is especially suited to flowcharts that become presentations. Organize the logic first, then guide the audience through the ordered path with movement and narration.
Technical implementation notes
Translate the communication goal into an audience action: understand, compare, decide, remember, or perform. Build a claim-evidence-reasoning chain and distinguish observed facts, interpretation, assumptions, uncertainty, and recommendations.
Use progressive disclosure: context first, then the model, evidence, exceptions, and implications. Define unfamiliar terms, keep labels close to what they describe, and test whether a reader can reconstruct the intended logic without the presenter present. The most relevant concepts here are flowchart vs mind map, mind map comparison, visual thinking tools. Define them when first used and apply each term consistently to an observable element, rule, or outcome.
- Audience and intended action are explicit
- Claims remain connected to evidence
- Assumptions and uncertainty are labeled
- Sequence ends with a clear implication or next step
Worked example: Flowchart vs. Mind Map: Which Visual Should You Use?
Assume monthly conversion moved from 4.0% to 4.6%. Before presenting a 15% relative increase, define conversion, show the absolute change of 0.6 percentage points, disclose the period, denominator, traffic mix, and uncertainty, and compare the same seasonal period when relevant.
Use a line or dot plot with a consistent scale, annotate the intervention date, and separate observation from attribution. End with a decision rule—for example, expand the test only if the lift persists and guardrail metrics remain within their thresholds.
Conclusion
The article’s main threads—the two formats answer different questions, choose a flowchart for sequence and decisions, choose a mind map for exploration and categorization, and use the formats at different stages of the same project—lead to a shared lesson: the quality of “Flowchart vs. Mind Map: Which Visual Should You Use?” can be tested. Technical criteria and a realistic example make strengths, omissions, and consequences visible.
Our judgment after considering the full article is that clear visual communication combines purposeful structure, accurate information, meaningful examples, and validation with the intended audience. Looking coherent is not enough; the result should help people understand and use the idea correctly.
Create the visual journey
Turn your process into a presentation
Build the diagram, choose the sequence, add narration or webcam video, and preview the camera movement in your browser.
Open Praebere