
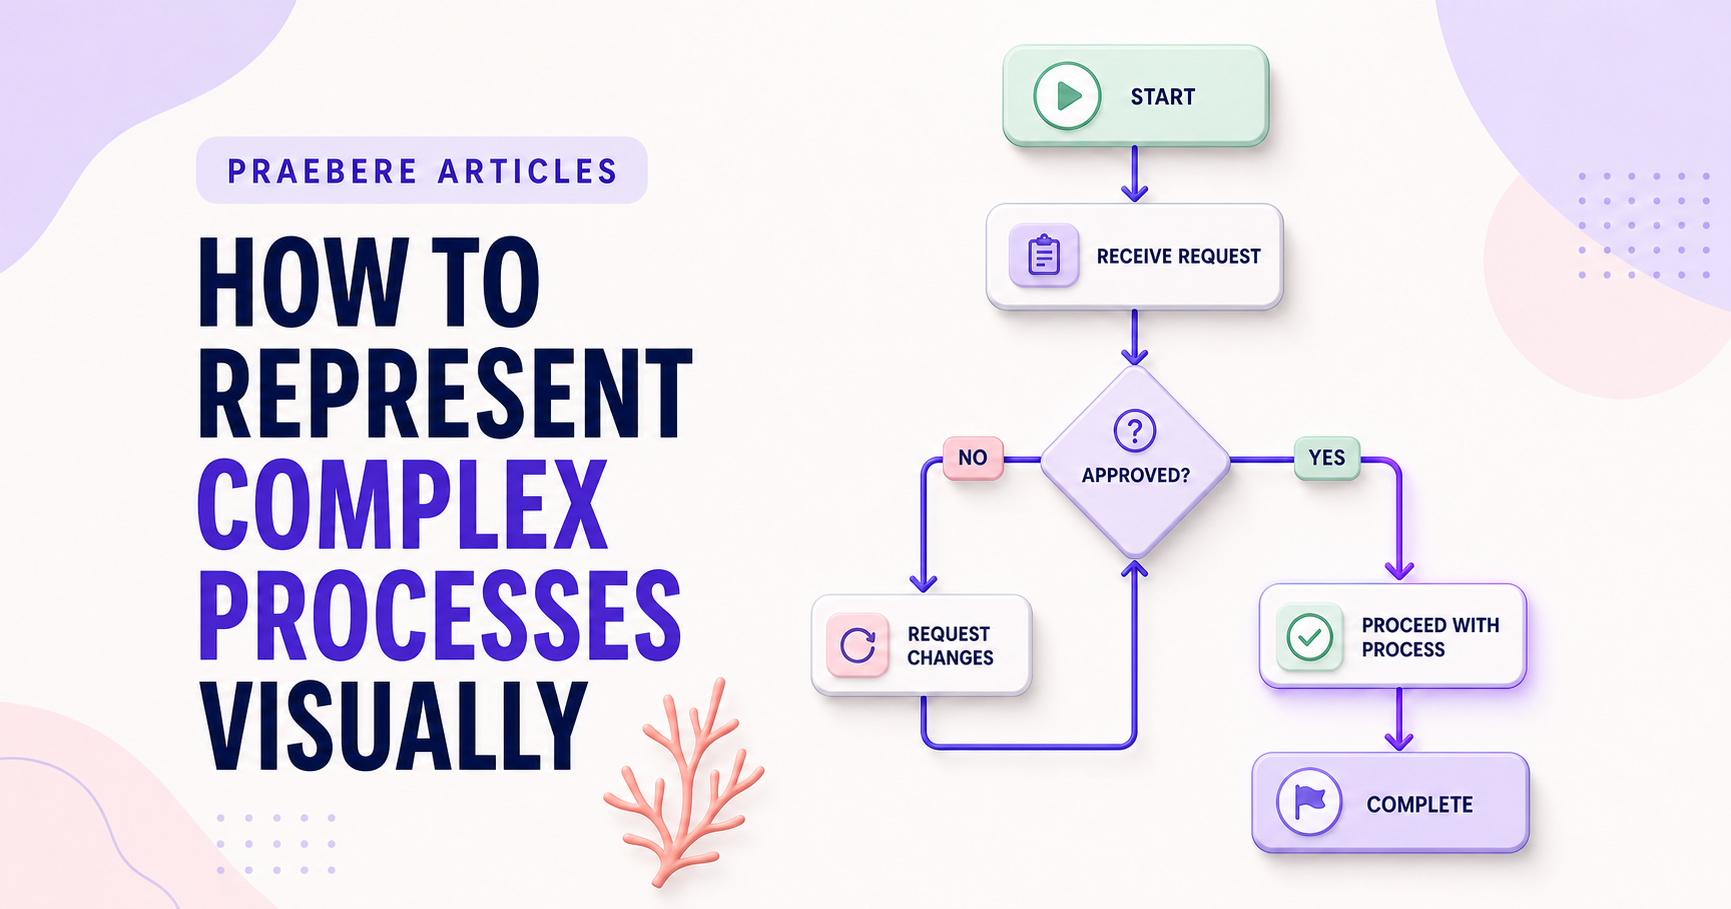
The practical decisions behind “How to Represent Complex Processes Visually”
Treat “How to Represent Complex Processes Visually” as a communication problem whose first layer appears in “Define the question before drawing the process.” A process model needs an explicit scope, start and end events, actors, inputs, outputs, decisions, exceptions, and ownership.
The practical challenge begins when general advice meets real content, real constraints, and a real audience. Where does the process truly begin and end, who owns each handoff, and what happens outside the ideal path? Could a new participant follow the decisions and exceptions without relying on undocumented knowledge? The sections ahead use these questions to move from the central idea to concrete decisions, technical criteria, and an applied example.
Define the question before drawing the process
A complex process contains more information than one diagram can communicate at once. Begin by defining the audience, the decision they need to make, and the boundaries of the process. Scope determines which details belong in the main view.
Identify a clear trigger and outcome. Without those boundaries, maps expand into related systems and exceptions until the central path becomes difficult to recognize.
Use levels of detail instead of one enormous chart
Create an overview with major phases, then separate detailed subprocesses for parts that require closer explanation. Reuse names and identifiers so readers can move between levels without losing context.
Group related steps into meaningful regions. Swimlanes can show responsibility, while containers can distinguish teams, systems, locations, or phases. The grouping should answer a real question rather than merely decorate the page.
Separate the main path from exceptions
Make the most common path visually dominant, then add alternate routes and exceptions with clear labels. If rare cases overwhelm the main view, move them to a linked subprocess or supporting document.
Check every decision for complete outcomes and every loop for a visible condition that eventually allows the process to continue. Unlabeled branches create ambiguity even when the layout is attractive.
Review the model with people who perform the work
Walk through realistic examples with process owners and participants. Confirm not only the official procedure but also handoffs, waiting states, tools, and exceptions that affect the actual result.
A large process may be easier to communicate as a guided journey. In Praebere, you can preserve the complete board while ordering the elements, choosing zoom levels, and recording narration so the audience moves from the overview to selected details without losing the larger structure.
Technical implementation notes
A process model needs an explicit scope, start and end events, actors, inputs, outputs, decisions, exceptions, and ownership. Use consistent symbols and verb-led activity labels, and separate the normal path from failures, retries, escalations, and manual review.
Validate the model by walking through real cases with the people who perform the work. Record assumptions, system boundaries, rule sources, version, owner, and review date so the diagram remains traceable instead of becoming an attractive but stale picture. The most relevant concepts here are visualize complex process, process mapping, complex workflow diagram. Define them when first used and apply each term consistently to an observable element, rule, or outcome.
- Every branch has a labeled condition
- Activities identify an action and responsible actor
- Exceptions and handoffs are visible
- The model has an owner and review trigger
Worked example: How to Represent Complex Processes Visually
Take a purchase request that begins with employee submission and ends with approval, rejection, or revision. Identify the requester, manager, finance team, and system; label the decision thresholds; and add branches for missing receipts, budget exceptions, duplicate requests, and timeout escalation.
Walk through a routine request and two edge cases with process owners. If participants disagree about a branch, record the governing rule and owner instead of choosing the visually simplest route. The corrected diagram can then become the sequence for a narrated presentation.
Conclusion
From define the question before drawing the process to review the model with people who perform the work, the discussion treated “How to Represent Complex Processes Visually” as a set of connected decisions. The example demonstrated how those decisions influence the result when real constraints and edge cases appear.
For us, the idea reaches its most useful conclusion here: a process visual becomes trustworthy only when it includes real decisions, responsibilities, handoffs, exceptions, and outcomes. The neatest diagram is not necessarily the most truthful one.
Create the visual journey
Turn your process into a presentation
Build the diagram, choose the sequence, add narration or webcam video, and preview the camera movement in your browser.
Open Praebere