
The practical decisions behind “How to Visualize the Complete Scrum Cycle With a Flowchart”
The work behind “How to Visualize the Complete Scrum Cycle With a Flowchart” starts with a practical concern captured by “Begin with the relationship the diagram must explain.” A process model needs an explicit scope, start and end events, actors, inputs, outputs, decisions, exceptions, and ownership.
The practical challenge begins when general advice meets real content, real constraints, and a real audience. What question should the data answer, and could the chosen scale or comparison lead viewers toward the wrong conclusion? Which definitions, baselines, filters, and uncertainties must remain visible before the audience can act on the pattern? The sections ahead use these questions to move from the central idea to concrete decisions, technical criteria, and an applied example.
Begin with the relationship the diagram must explain
A Scrum visual can teach the event sequence, show which artifact is inspected, clarify accountabilities, or explain how feedback changes product direction. Trying to show every rule and practice in one flowchart creates a dense poster rather than a usable model.
Define the audience and primary question first. A newcomer may need the complete cycle; a Scrum Team diagnosing weak feedback may need a more detailed view of Review, Product Backlog adaptation, and the next Sprint.
Draw the Sprint as a repeating container
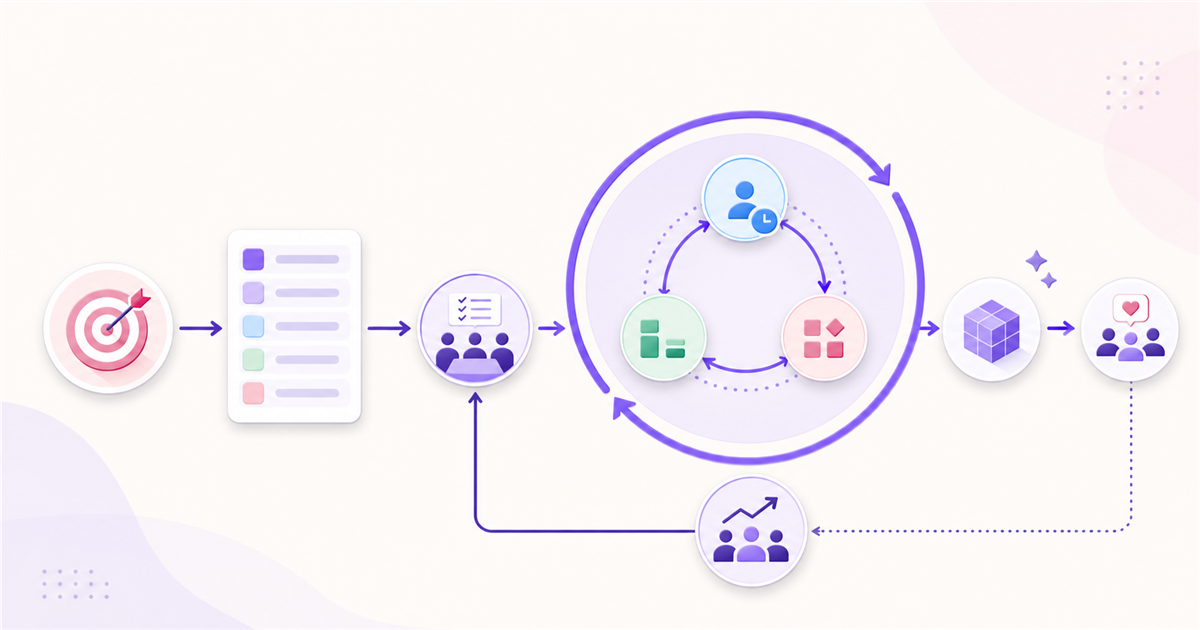
Place Sprint Planning at the beginning of the visible cycle, Daily Scrum and creation work within the Sprint, then Sprint Review and Sprint Retrospective before the next Sprint begins. Show Product Backlog refinement as ongoing activity rather than inventing a required sixth Scrum event.
Represent the Product Goal feeding the Product Backlog, the Sprint Goal within the Sprint Backlog, and the Definition of Done governing the Increment. This connects each artifact with its commitment.
- Use a loop to show immediate continuation between Sprints.
- Differentiate formal Scrum elements from optional practices.
- Label inspection and adaptation arrows.
- Keep accountabilities separate from event sequence.
Make feedback loops more visible than task handoffs
Connect the Daily Scrum to an adapted Sprint Backlog, the Sprint Review to Product Backlog changes, and the Retrospective to improvements in the next Sprint. These loops communicate empiricism more accurately than a linear chain of meetings.
Use swimlanes only when responsibility is the lesson. The Product Owner, Scrum Master, and Developers collaborate across multiple events, so avoid a diagram that implies each event is owned and executed by one isolated role.
Turn the full diagram into a guided visual presentation
Start with the complete framework, then move through the Product Goal, Sprint Planning, daily adaptation, Increment, Sprint Review, and Retrospective. Return to the overview between stages so viewers preserve their orientation in the cycle.
In Praebere, assign an order to the relevant shapes, use restrained camera movement, and add narration that explains why each feedback loop exists. The final video should clarify Scrum’s adaptive structure without suggesting that the diagram itself is an executable project plan.
Technical implementation notes
A process model needs an explicit scope, start and end events, actors, inputs, outputs, decisions, exceptions, and ownership. Use consistent symbols and verb-led activity labels, and separate the normal path from failures, retries, escalations, and manual review.
Validate the model by walking through real cases with the people who perform the work. Record assumptions, system boundaries, rule sources, version, owner, and review date so the diagram remains traceable instead of becoming an attractive but stale picture. The most relevant concepts here are Scrum flowchart, Scrum cycle diagram, visualize Scrum process. Define them when first used and apply each term consistently to an observable element, rule, or outcome.
- Every branch has a labeled condition
- Activities identify an action and responsible actor
- Exceptions and handoffs are visible
- The model has an owner and review trigger
Worked example: How to Visualize the Complete Scrum Cycle With a Flowchart
Assume monthly conversion moved from 4.0% to 4.6%. Before presenting a 15% relative increase, define conversion, show the absolute change of 0.6 percentage points, disclose the period, denominator, traffic mix, and uncertainty, and compare the same seasonal period when relevant.
Use a line or dot plot with a consistent scale, annotate the intervention date, and separate observation from attribution. End with a decision rule—for example, expand the test only if the lift persists and guardrail metrics remain within their thresholds.
Conclusion
Taken together, begin with the relationship the diagram must explain, draw the sprint as a repeating container, make feedback loops more visible than task handoffs, and turn the full diagram into a guided visual presentation show that “How to Visualize the Complete Scrum Cycle With a Flowchart” is not an isolated technique. The article connected its central principles to implementation details and a practical case, making the tradeoffs easier to see.
For us, the idea reaches its most useful conclusion here: a process visual becomes trustworthy only when it includes real decisions, responsibilities, handoffs, exceptions, and outcomes. The neatest diagram is not necessarily the most truthful one.
Create the visual journey
Turn your process into a presentation
Build the diagram, choose the sequence, add narration or webcam video, and preview the camera movement in your browser.
Open Praebere