
Abstract
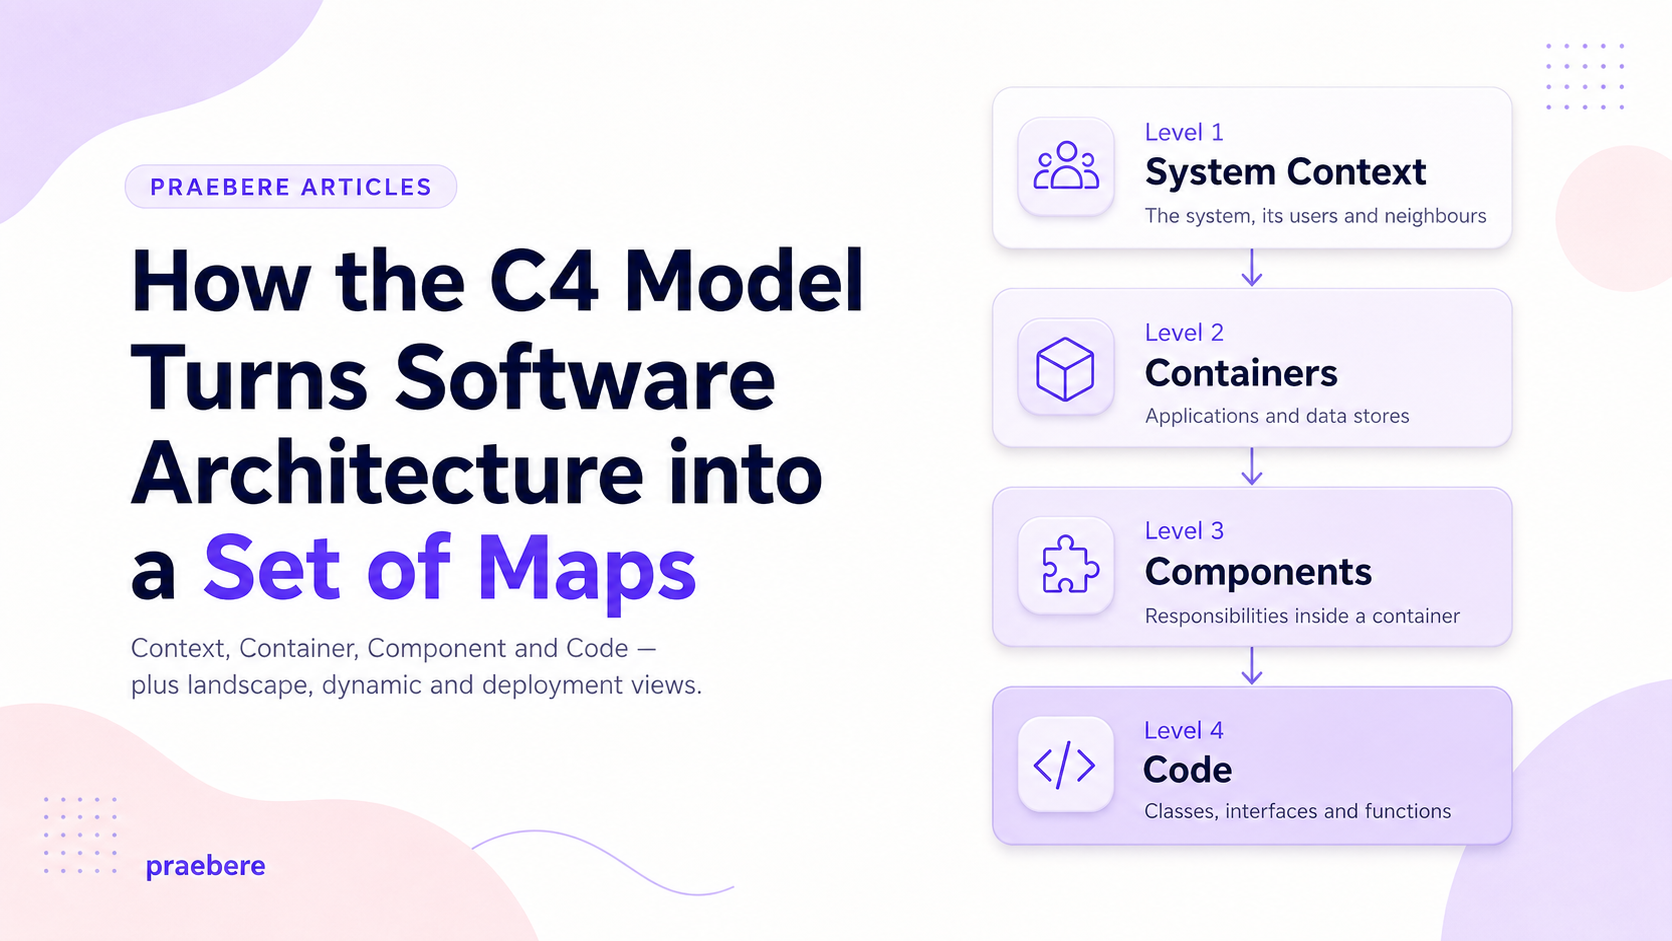
The C4 Model is an approach for visualizing and communicating software architecture through a small set of hierarchical abstractions and diagrams with progressively increasing levels of detail. Its name comes from the four central structural diagrams: Context, Container, Component, and Code. Rather than prescribing a rigid visual notation, C4 prioritizes clear abstractions, an explicit scope, and views designed for a particular audience. The approach also includes the supporting System Landscape, Dynamic, and Deployment diagrams.
This article explains the historical origins of C4, its relationship with the theory of multiple architectural views, its fundamental concepts, the elements that are modeled, the diagram types, visual communication rules, practical adoption and maintenance, and its integration with UML, Domain-Driven Design, arc42, Architecture Decision Records, security, APIs, cloud computing, DevOps, and observability. It also discusses limitations and common antipatterns. A didactic case study applies all diagram types to Praebere, moving from the surrounding ecosystem to containers, components, code, runtime interaction, and deployment.
Keywords: C4 Model; C4 Modeling; C4 Diagrams; software architecture; architecture documentation; diagrams as code; Structurizr; UML.
1. Introduction: why architectures need maps
Every software system has an architecture, even when nobody has drawn it. Code is divided into parts, runs in processes, stores information, communicates through protocols, and depends on people and external systems. The difficulty begins when this knowledge remains scattered across repositories, configuration files, conversations, and the memories of a few experienced professionals. The organization then depends on oral explanations, improvised diagrams, and conflicting interpretations.
An architecture diagram should behave like a map. Maps do not reproduce every tree, stone, or building in a territory. They select information according to a purpose: a road map emphasizes roads, a political map emphasizes borders, and a subway map sacrifices geographic accuracy to make navigation easier. Software documentation follows the same principle. One drawing cannot simultaneously explain the business context, executable applications, internal modules, the path of a transaction, infrastructure, security controls, and source code.
The C4 Model gives structure to this problem. It creates maps of software at different zoom levels, using abstractions that are close to the way development teams think about and build systems. The official description presents C4 as a developer-friendly, abstraction-first approach based on hierarchical diagrams, complemented by landscape, dynamic, and deployment views, without mandating a particular tool or visual notation [1].
1.1 The problem with boxes-and-arrows diagrams
Teams often abandon formal languages and use simple boxes and arrows. This can be productive, but it creates ambiguity when there is no shared language. A box might mean an application, microservice, module, server, team, domain, or deployment unit. An arrow might mean a synchronous call, data flow, compile-time dependency, asynchronous event, ownership, or a vague association.
C4 does not eliminate boxes and arrows. Instead, it gives them a minimum semantic structure. It asks the author to identify what kind of element each box represents, separates levels of detail, and recommends explicit responsibilities, technologies, boundaries, and relationships. The value is not a special geometric shape; it is the reduction of hidden assumptions.
1.2 Where C4 is used today
There is no centralized and auditable census of worldwide C4 adoption, so it is more accurate to describe contexts of use than to claim absolute numbers. C4 is used in the documentation of digital products, corporate systems, internal platforms, microservices, APIs, cloud solutions, legacy modernization, onboarding, security architecture, risk assessment, threat modeling, and communication among development, infrastructure, and operations teams. The publication of a dedicated O'Reilly book in 2026 further consolidated the approach [16].
In practical terms, C4 is particularly useful when an organization needs to answer questions such as: What is the boundary of this system? Which applications and data stores compose it? Who depends on it? Through which elements does a request travel? Where are its containers deployed? Which part of the implementation owns a critical responsibility?
2. History and context of the C4 Model
The history of C4 is part of the broader evolution of architecture documentation. Software engineering has always needed representations that turn invisible structures into artifacts that people can inspect, discuss, and challenge. Before C4, several approaches already addressed decomposition, multiple perspectives, components, deployment, and behavior.
2.1 Multiple views before C4
In 1995, Philippe Kruchten introduced the 4+1 view model, in which an architecture is described through concurrent views for different stakeholders: logical, development, process, physical, and scenarios. Its main contribution to understanding C4 is not a direct one-to-one mapping between diagrams, but the principle that a complex architecture must be observed from several perspectives [14].
The Unified Modeling Language, standardized in the 1990s and maintained by the Object Management Group, offered a broad language for visualizing, specifying, and documenting structure and behavior [15]. UML includes class, component, deployment, sequence, activity, state, and other diagram types. Nevertheless, its breadth and formal semantics did not prevent many teams from returning to informal drawings. C4 was designed for the space between no structure at all and the full use of an extensive modeling language.
2.2 The origin of C4
According to Simon Brown, C4 grew out of architecture exercises used during training courses. Groups received requirements, designed a solution, and drew diagrams. The diversity of the results exposed a recurring problem: even when the architecture itself was reasonable, the visual communication was inconsistent. C4 formalized the way Brown already represented software architecture and then evolved incrementally [2].
Its roots are placed between 2006 and 2009. The terms Context, Containers, Components, and Classes were named in early 2010, the expression C4 started being used in 2011, and the fourth level was renamed from Classes to Code around 2015-2016. That change matters because the lowest level does not have to be object-oriented; it can represent functions, modules, database tables, interfaces, objects, or other implementation elements [2].
2.3 The problems C4 attempted to solve
- No clear order for reading architecture diagrams.
- Several abstraction levels mixed in the same drawing.
- Inconsistent names and symbols across documents.
- Missing explanations of responsibilities and technologies.
- Too much detail for some audiences and too little for others.
- Difficulty connecting a high-level view to code and deployment.
- Documentation that ages quickly because it is expensive or difficult to update.
The intention is not to replace every earlier technique. The official FAQ explicitly recommends complementing C4 with state, timing, process, data, and other diagrams whenever the question extends beyond the structural focus of the model [13].
3. Theoretical foundations: model, view, abstraction, and audience
C4 appears simple because it uses only a few abstractions, but that simplicity rests on important ideas from architecture description. Understanding those ideas prevents the method from becoming a mechanical exercise in producing four drawings.
3.1 Architecture is not the diagram
Architecture consists of decisions, structures, responsibilities, constraints, quality attributes, and relationships that shape a system. A diagram is only a partial representation of that architecture. It deliberately omits details in order to answer a particular question.
ISO/IEC/IEEE 42010:2022 distinguishes an entity's architecture from the architecture description that expresses it and addresses concepts such as stakeholders, concerns, viewpoints, models, and architecture description languages [17]. C4 can be understood as a lightweight set of abstractions and visual viewpoints for part of that work. By itself, it is not a complete architecture description for every possible purpose.
3.2 Model, view, and diagram
A model contains elements and relationships that represent the system: people, software systems, containers, components, technologies, boundaries, descriptions, and dependencies. A view selects a subset of that model for a particular purpose. A diagram is the visual presentation of the view.
This distinction is critical in model-as-code tooling. The relationship "Web Editor writes to Project Storage" can be defined once in the model and reused in a container view, a dynamic view, and a deployment view. Reuse reduces divergence, although it does not eliminate the need for human review and editorial judgment.
3.3 Abstraction-first thinking
The official site describes C4 as abstraction-first. Instead of beginning with the question "Which symbol should I draw?", the modeler first asks what entity is being represented and at which level it exists [3]. The basic hierarchy is: a software system contains containers; a container contains components; a component is implemented by code elements. People use systems, and systems relate to other systems.
Abstraction does not mean vagueness. It means selecting the properties that matter to the current conversation. In a context diagram, the internal database may be irrelevant. In a container diagram, it may become central. In a code diagram, HTTPS may cease to be the focus while interfaces and internal dependencies become important.
3.4 Hierarchical zoom and semantic continuity
C4 levels behave like zooming into a map. The system highlighted in the context view opens into containers; one selected container opens into components; and one important component may open into code. For this zoom to be trustworthy, the enlarged element must preserve its identity and responsibility across views.
This continuity reduces semantic jumps. A reader should not leave a context diagram containing a system named "Sales Platform" and find the next view populated only by boxes called "svc-a", "core-2", and "db-x" without knowing how they relate to the previous map. Names, boundaries, and descriptions should form a continuous narrative.
3.5 Audience, concern, and level of detail
| Audience | Typical questions | Most useful views |
|---|---|---|
| Executives and business areas | What value does the system deliver? Who uses it? Which systems does it depend on? | System Landscape and System Context |
| Architects and developers | How are responsibilities distributed? Which technologies and integrations exist? | Container, Component, Dynamic |
| Operations and platform teams | Where does it run? How does it scale? Which nodes and operational dependencies exist? | Container and Deployment |
| Security and risk teams | Where are trust boundaries, inputs, sensitive data, and external integrations? | Context, Container, Dynamic, and Deployment |
| New team members | What is the overall map, and where is the area I will work on? | Context, Container, and selected components |
A view should not be chosen because a template requires it; it should be chosen because it answers a question. The official guidance notes that context and container diagrams are sufficient for many teams, while component and code views should be created when they add real value [4].
4. The central C4 abstractions
The abstractions are the conceptual vocabulary of C4. The notation can vary, but the meaning of each modeled element must remain clear and consistent.
4.1 Person
A Person represents a human being, role, persona, group, or actor that interacts with a system. Its name should reflect the relevant responsibility - for example, "Customer", "Risk Analyst", or "Support Operator" - rather than the generic word "User". People may be inside or outside the organization.
A person does not have to correspond to one physical individual. It represents a usage perspective. When two roles use the same system in substantially different ways, modeling them separately improves the explanation of relationships and responsibilities.
4.2 Software System
A Software System is the highest level in the hierarchy and represents something that delivers value to human or non-human users. Defining its boundary is both an architectural and organizational decision. The official material suggests thinking of something a team builds, owns, can change, and whose internal implementation it understands [18].
A software system should not automatically be equated with a business domain, bounded context, team, commercial product, or repository. Those dimensions may coincide in a particular organization, but they are not identical. One product can contain several systems, one system can span several repositories, and one team can maintain more than one system.
4.3 Container
A container is normally an executable or storage unit with its own responsibility and technology. Examples include a Spring Boot API, an Angular application, an Android application, a PostgreSQL database, a serverless function, or an integration process. The container diagram exposes the high-level shape of the architecture, the main technology choices, and communication among those units [5].
Container boundaries should reflect runtime and responsibility rather than folder structure. Two modules in the same process are usually components of one container. Two independently deployable services are usually different containers, even when they live in the same repository.
4.4 Component
In C4, a Component is a grouping of related functionality encapsulated behind a well-defined interface. It is not independently deployed; the containing container is deployed. In Java, a component may group interfaces, implementation classes, controllers, services, and adapters. In JavaScript, it may be a coherent module; in functional programming, a collection of related functions and types [6].
Components should represent architecturally significant units rather than every class, package, or file. A useful question is: "Which cohesive responsibility exists here, and through which interface do other parts use it?" If the answer is only "this is the utils folder", the abstraction is probably not yet meaningful.
4.5 Code
Code represents basic implementation elements such as classes, interfaces, objects, functions, modules, tables, schemas, procedures, or equivalent structures. This level is optional, changes quickly, and can often be generated on demand by IDEs and analysis tools. The official guidance recommends reserving it for important or complex components [7].
The goal is not to print the entire codebase. A useful code diagram selects only the elements needed to explain a pattern, critical rule, extension mechanism, data model, or difficult decision. Trivial properties and methods can be omitted.
4.6 Relationships, boundaries, and properties
Relationships express how one element depends on, calls, sends data to, publishes to, queries, or otherwise collaborates with another. The arrow direction must agree with the text. "API queries the database" requires an arrow from the API to the database. Vague labels such as "uses" or "integrates" should be replaced, when possible, with a verb and an object: "requests authorization using OAuth 2.0", "publishes order events to Kafka", or "reads and writes customer data through JDBC".
Boundaries express scope and ownership: the software system boundary, the container currently in focus, a deployment environment, network, cloud account, or trust zone. Properties such as technology, protocol, data classification, criticality, owner, and lifecycle status can enrich the model, but should appear in a view only when they help answer its question.
| Abstraction | Question answered | Examples |
|---|---|---|
| Person | Who interacts with the system? | Customer, operator, or consuming actor |
| Software System | Which solution delivers value, and where is its boundary? | Internet Banking, Payment Platform, Praebere |
| Container | Which applications and data stores execute or store the solution? | SPA, API, service, database, function, mobile app |
| Component | How does an application divide internal responsibilities? | Controller, domain service, adapter, repository |
| Code | How is a component implemented? | Classes, interfaces, functions, tables |
5. The four main C4 diagrams
The name C4 comes from four diagrams that describe static structure. Each diagram has a different scope, primary content, audience, and recommendation for use.
| Diagram | Scope | Core content | Audience | Recommendation |
|---|---|---|---|---|
| System Context | One system | The system in focus, people, and directly related external systems | All audiences | Recommended |
| Container | One system | Applications, data stores, technologies, and communication | Architecture, development, support, and operations | Recommended |
| Component | One container | Components, responsibilities, and internal dependencies | Architects and developers | Only when it adds value |
| Code | One component | Classes, interfaces, functions, tables, or equivalents | Architects and developers | Optional; preferably generated |
5.1 System Context Diagram
The System Context Diagram is the usual starting point. It places the software system in focus at the center and shows people and external systems directly connected to it. Its objective is to explain the environment and dependencies without exposing internal technology. It is suitable for technical and non-technical audiences and is recommended for every team [8].
Expected content includes a title with type and scope, the system in focus, people, external systems, labeled relationships, an ownership boundary when needed, and a legend. Content that should normally be avoided includes internal frameworks, internal databases, pods, internal queues, classes, endpoints, and low-level infrastructure.
Example question: Where does the Payment Platform fit in the ecosystem, who uses it, and with which external systems does it exchange information?
5.2 Container Diagram
The Container Diagram opens the software system boundary and shows its internal applications and data stores. It should explain the distribution of responsibilities, the main technology choices, and communication between containers. For many teams, this is the diagram that most effectively communicates the overall architectural shape of a product [5].
A container diagram is not a deployment diagram. It does not need to show replica counts, clusters, load balancers, regions, or machines, because those details may vary by environment. They belong in deployment views.
Example question: Which applications compose Internet Banking, and how do the SPA, API, database, and notification system communicate?
5.3 Component Diagram
The Component Diagram opens one container and shows its internal units of responsibility. It is useful for complex containers, critical modules, legacy systems, or areas where internal structure is not evident from the code. The official guidance recommends not producing component views automatically for every container unless automation can keep them current [6].
A component should have a name, type, description, relevant technology or pattern, and relationships. External elements directly connected to the component may appear for context. The diagram should avoid hundreds of components and tangled lines. Large systems are better documented through views filtered by use case, domain, layer, or responsibility.
Example question: Inside the Payments API, which components validate the request, apply business rules, persist transactions, and publish events?
5.4 Code Diagram
The Code Diagram opens one component and presents part of its implementation. It can use a UML class diagram, entity-relationship model, modules, functions, or another suitable representation. It is valuable for complex patterns, extension points, algorithms, critical data models, or internal APIs, but unsuitable as comprehensive manual documentation for a rapidly changing codebase [7].
Example question: Which interfaces and classes implement the persistence adapter, and how is dependency inversion applied?
6. Supporting diagrams
The four core diagrams describe static structure, but architecture also involves organizational context, runtime behavior, and physical or cloud execution. C4 therefore defines three supporting diagram types that reuse elements from the same model.
6.1 System Landscape Diagram
The System Landscape Diagram shows people and software systems within an organization, department, domain, or portfolio without placing one system at the center. It can be understood as a context view without a single protagonist. It creates a bridge to enterprise architecture and is particularly useful in large organizations [9].
Its value lies in revealing dependencies, redundancies, central platforms, critical integrations, and ownership boundaries. To remain readable, the scope must be declared explicitly, such as "Payment Domain Landscape", "Digital Channels Landscape", or "Architecture of Division X". A landscape should not become an unfiltered inventory of every application the company has ever operated.
6.2 Dynamic Diagram
A Dynamic Diagram shows how elements from the static model collaborate at runtime to execute a story, use case, operation, or failure scenario. It may use a collaboration style with numbered interactions or a sequence-oriented style. Elements can be software systems, containers, or components, provided that the view makes the chosen abstraction level clear [10].
Dynamic views should be selective. Typical subjects include authentication, authorization, payment, asynchronous processing, compensation, caching, content export, and failure handling. There is no need to document every endpoint. The purpose is to explain architecturally significant behavior, particularly when order, branching, asynchronous messaging, retries, or security controls are difficult to infer from a static diagram.
6.3 Deployment Diagram
A Deployment Diagram maps instances of software systems and containers to deployment nodes in a specific environment. It can show devices, virtual machines, clusters, platform services, runtimes, networks, regions, availability zones, load balancers, firewalls, and DNS. Because environments differ, a separate view is normally created for each relevant environment, such as development, staging, and production [11].
A deployment node represents a place where something runs and may contain other nodes. A Kubernetes cluster can contain namespaces and workloads; a cloud account can contain regions and managed services; a user device can contain a browser, application, and local storage. Container diagrams explain logical executable structure, while deployment diagrams explain where instances of that structure run.
| Supporting diagram | Primary question | When to use it |
|---|---|---|
| System Landscape | How do the systems within an organizational scope relate? | Portfolio analysis, enterprise architecture, dependencies, and ownership |
| Dynamic | How does an important capability execute at runtime? | Complex, asynchronous, critical, or recurring flows |
| Deployment | Where do instances run in a particular environment? | Cloud, networks, clusters, high availability, and operational security |
7. Notation and visual language
C4 is notation-independent. It does not require blue boxes, gray boxes, specific icons, or one particular tool. This freedom does not remove the rules of communication. A notation must be self-explanatory, and every diagram should include a legend when colors, shapes, line styles, or icons have meaning [12].
7.1 Title, diagram type, and scope
Every diagram should state what it is and what it covers. A title such as "Architecture" is insufficient. Better titles include "System Context - Customer Service Platform", "Container Diagram - Internet Banking", and "Production Deployment - Payments Domain". For dynamic and deployment views, include the scenario or environment.
A clear title prevents the reader from having to infer the abstraction level. It also makes exported images, wiki attachments, and presentation slides understandable when separated from the original document.
7.2 Content of each element
| Information | Purpose | Example |
|---|---|---|
| Name | Gives the element a stable identity | Payments API |
| Type | Declares the C4 abstraction | Container: Java/Spring application |
| Responsibility | Explains what the element does | Validates and processes payment requests |
| Technology | Records a relevant implementation choice | Java 21, Spring Boot, PostgreSQL |
| Status or perspective | Adds lifecycle, risk, owner, or data information | Strategic; owner: Payments Team |
Names should be stable, specific, and meaningful. Acronyms should be expanded in the element or legend unless they are unquestionably familiar to the intended audience. Descriptions should focus on responsibility rather than restating the name. Technology labels should be included where they clarify an architectural decision, not merely to display every library in the dependency tree.
7.3 Relationships
Every important relationship should have a direction and a meaningful label. Prefer active descriptions such as "Sends payment request using HTTPS/JSON", "Publishes OrderCreated events to Kafka", or "Reads customer records through JDBC". The wording and arrow must agree. When communication is bidirectional, two labeled relationships are often clearer than one vague double-headed arrow.
Protocols and technologies belong on relationships when they matter to the question. A context view may say only "Submits orders"; a container view may refine the same relationship to "HTTPS/JSON using OAuth 2.0". The model is consistent even when each view reveals a different amount of information.
7.4 Colors, shapes, icons, and accessibility
Visual style should reinforce meaning without becoming the only carrier of meaning. Do not rely solely on color to distinguish people, internal systems, external systems, or lifecycle status. Combine color with explicit type labels, shapes, line styles, or textual markers so that the diagram remains understandable in grayscale and for readers with color-vision differences.
Icons can improve recognition but may also increase cognitive load, create vendor lock-in, and become outdated. A cloud provider logo is less informative than a clear label such as "Managed PostgreSQL Database [Container]". If icons are used, the legend must explain them and text should remain sufficient.
7.5 Legend and visual consistency
A legend explains colors, shapes, boundaries, arrows, line styles, and special perspectives. Even a seemingly obvious diagram benefits from a small legend because the image may circulate outside its original context. The same element should keep the same name, type, and preferably the same visual treatment across all views.
| Visual element | Recommended meaning | Caution |
|---|---|---|
| Solid arrow | Runtime or structural relationship described by its label | Do not assume readers know the meaning without text |
| Dashed arrow | Special relationship such as implementation or asynchronous dependency | Define it in the legend |
| Boundary | System, container in focus, organization, network, or environment | Name the boundary explicitly |
| Color | Category, ownership, status, or perspective | Never use color as the only distinction |
| Icon | Recognition of a technology or role | Keep labels and avoid decorative overload |
8. A practical C4 Modeling process
8.1 Start with the question, not the tool
Before opening a drawing application or writing a DSL, define the question the view must answer. Examples include: How does this system fit into the organization? Which executable applications compose it? How does authentication occur? Which infrastructure supports production? A precise question controls scope and prevents decorative diagrams with no decision-making value.
8.2 Define scope and boundaries
Choose the software system or organizational area being modeled, declare ownership, and distinguish internal from external elements. Boundary decisions should be explicit rather than accidental. A shared API gateway, identity provider, or enterprise message broker may be an internal container of one platform, a separate shared software system, or an external dependency, depending on ownership and the purpose of the model.
The scope should also state whether the view describes the current state, a target architecture, a transition stage, or a proposal. Mixing current and future elements without a visual distinction creates false confidence and can lead to incorrect operational decisions.
8.3 Identify stakeholders and concerns
List who will read the view and what they need to learn. Business stakeholders usually need value, actors, and external dependencies. Developers need responsibilities, interfaces, technologies, and code ownership. Operations teams need environments, runtime nodes, scaling, and failure domains. Security teams need entry points, trust boundaries, sensitive data, identity flows, and external dependencies.
8.4 Build the static model
- Model the people and external systems that are directly relevant.
- Define the software system in focus and its boundary.
- Decompose the system into containers with responsibilities and technologies.
- Select only the containers that genuinely require component views.
- Model code only for critical, complex, or educational areas.
- Describe relationships with direction, purpose, and technology when useful.
8.5 Add supporting views
Use dynamic views for important runtime stories and deployment views for environments. Use a landscape when understanding depends on the broader portfolio. Complement C4 with domain models, data models, state diagrams, business processes, ADRs, and quality requirements because C4 does not attempt to express everything.
8.6 Review collaboratively
The best test is to show a view to someone who did not create it and ask that person to explain the system. Questions and misunderstandings reveal missing labels, ambiguous scope, weak legends, and incorrect abstraction. Architecture reviews can use the diagrams to explore risk, security, capacity, availability, data ownership, cost, and operational responsibility.
A review should also compare the views with code, infrastructure, service catalogs, and runtime evidence. A visually elegant diagram that disagrees with reality is more dangerous than no diagram because it creates confidence in a false model.
8.7 Evolve incrementally
Begin with context and containers. Add components, dynamics, and deployment only when questions arise. The model should evolve with significant architectural decisions, not with every commit. Lower-level views change faster and are stronger candidates for automated generation or validation [19].
9. C4 in modern architectures
9.1 Microservices
In C4, an independently deployable microservice is commonly modeled as a container. Hundreds of microservices make one container diagram unreadable; the answer is not to abandon C4 but to create filtered views by domain, user journey, team, criticality, or dependency. A system landscape can show coarser-grained systems, while multiple container views show relevant subsets.
A microservice is not automatically a software system. Depending on ownership and organizational design, a set of microservices may compose one software system. In other cases, services with independent teams, lifecycles, and business responsibilities may be modeled as separate systems. The choice must be consistent and documented.
9.2 APIs and API gateways
An API is not automatically a container. If "API" means an executable application, such as a deployed Spring Boot service, it can be modeled as a container. If it means only a contract exposed by an application, it is a property of the container interface or relationship. An API gateway can be a container within the system, a separate shared system, or an infrastructure node, depending on ownership and purpose.
Container diagrams should identify important protocols and standards such as REST/HTTPS, gRPC, WebSocket, AMQP, Kafka, OAuth 2.0, OpenID Connect, and mutual TLS. Dynamic diagrams can expose token validation, routing, transformation, backend calls, rate limiting, caching, and event publication when those steps are architecturally significant.
9.3 Messaging and event-driven architecture
Queues and topics can be modeled as containers/data stores or as technology on relationships. Both approaches are valid; the choice depends on the story the view must tell. If a topic has operational significance, retention, ownership, contracts, and lifecycle, showing it explicitly may be useful. If that makes the drawing noisy, a relationship such as "publishes events to Kafka" may be sufficient [20].
Relationships should distinguish commands, events, and queries. Labels such as "Publishes OrderCreated" and "Consumes OrderCreated" communicate coupling and ownership more clearly than two generic arrows pointing to a broker.
9.4 Serverless architectures
Serverless functions can be containers when they are independently deployed execution units with their own responsibilities. However, drawing hundreds of functions individually rarely helps. Group or filter them by flow, domain, or product. Managed databases, queues, object stores, and orchestration services remain containers or deployment nodes according to the selected view.
9.5 Cloud, Kubernetes, and high availability
Kubernetes clusters, pods, replicas, regions, availability zones, ingress controllers, service meshes, and load balancers primarily belong in deployment diagrams. The container diagram describes the logical executable architecture; the deployment view describes how many instances exist, where they execute, and how infrastructure supports scalability, resilience, and security.
Do not replace responsibilities with provider logos. "Authentication Service [Container: Java/Spring]" communicates more than an unlabeled Kubernetes or cloud icon. Technology icons may support recognition, but names and responsibilities must remain explicit.
9.6 Data systems and artificial intelligence
Data platforms can model ingestion, transformation, storage, serving, and orchestration as containers. A machine-learning model may be an artifact or part of an inference container. Dynamic views should separate training, model publication, batch scoring, and online inference when their lifecycles differ. Sensitive datasets, feature stores, model registries, external AI services, and governance controls can be annotated through security and ownership perspectives.
10. Integration with other practices and notations
10.1 C4 and UML
C4 and UML are not absolute competitors. C4 supplies abstractions and levels of zoom; UML supplies a broad family of standardized notations. The official guidance notes that central C4 diagrams can be illustrated with UML packages, components, stereotypes, classes, and deployment nodes, although some UML tooling makes rich descriptive text less convenient [12].
| Aspect | C4 | UML |
|---|---|---|
| Focus | Architecture communication through abstraction levels | Broad language for structure and behavior |
| Notation | Lightweight and notation-independent | Standardized and semantically extensive |
| Central types | Context, Container, Component, Code | Classes, components, sequences, states, deployment, and more |
| Combined use | Defines what to show and at which level | Can provide the notation for code, dynamic, or deployment views |
10.2 C4 and Domain-Driven Design
Domain-Driven Design organizes domain knowledge, ubiquitous language, bounded contexts, aggregates, and models. C4 visualizes software systems and technical structures. A bounded context is not automatically a software system or container, but it can influence boundaries. Context maps can complement system landscapes; components can reflect domain modules; relationships can record contracts between contexts.
The two approaches answer different questions. DDD asks how domain knowledge should be structured and expressed. C4 asks how software elements, responsibilities, and dependencies should be communicated. Using them together prevents a purely technical diagram from losing business meaning and prevents a domain model from hiding runtime and deployment realities.
10.3 C4 and arc42
The official FAQ describes a common correspondence: arc42 Context and Scope with a System Context Diagram; Building Block View level 1 with a Container Diagram; level 2 with a Component Diagram; and level 3 with a Code Diagram [2]. Arc42 provides a broader documentation structure that also includes goals, constraints, decisions, quality requirements, risks, and a glossary. C4 supplies a coherent subset of the visualizations.
10.4 C4 and Architecture Decision Records
Diagrams show an architectural state or intention; ADRs record why a decision was made, which alternatives were considered, and which consequences were accepted. A view can link to relevant ADRs, and an ADR can refer to elements in the model. The combination reduces the risk of a diagram explaining what exists without explaining why it exists.
10.5 C4, security, and threat modeling
System Context and Container views help identify actors, inputs, dependencies, data flows, trust boundaries, and attack surfaces. Dynamic views expose authentication, authorization, token exchange, and sensitive runtime flows. Deployment views show networks, firewalls, gateways, regions, secrets, and security zones. C4 does not replace a threat-modeling methodology, but it provides a consistent map on which one can be applied.
A useful technique is to create a filtered security view with perspectives such as personal data, criticality, exposure, authentication, encryption, and ownership. The legend must explain each perspective, and the diagram should link to detailed controls, threat records, or risk assessments when appropriate.
10.6 C4 and observability
Model elements can link to service catalogs, repositories, dashboards, traces, alerts, runbooks, and service-level objectives. Distributed traces can help validate dynamic relationships, while infrastructure-as-code and service discovery can help update deployment views. Observability does not automatically produce an architecture model, but runtime evidence is valuable for verifying whether the documented relationships actually occur.
11. Tools and diagrams as code
C4 is tool-independent. It can be drawn on a whiteboard or paper, in free-form diagramming software, in visual modeling tools, through a domain-specific language, or directly from code. The choice should consider collaboration, version control, automation, layout, accessibility, and the ability to maintain consistency across views.
| Category | Advantages | Limitations | Best use |
|---|---|---|---|
| Whiteboard or paper | Fast, collaborative, excellent for discovery | Low durability and difficult to update | Workshops and initial design |
| Free-form diagramming | Low barrier and strong visual control | Duplication and inconsistency across views | One-off communication and small teams |
| Visual modeling | Element reuse, metadata, navigation, and consistency | Tool learning curve and possible lock-in | Living documentation and collaboration |
| Diagrams as code | Git, review, automation, generation, and templates | DSL learning curve and less intuitive layout | Technical teams and versioned documentation |
11.1 Structurizr and model as code
Structurizr was created by the author of C4 as a models-as-code approach. Its DSL defines people, software systems, containers, components, relationships, properties, and views. The documentation emphasizes compatibility with version control, Git-based collaboration, automation, and proximity to technical teams, while also acknowledging a learning curve and reduced accessibility for non-technical contributors [21].
The important distinction is that the textual source represents a semantic model rather than a collection of unrelated drawing commands. One relationship can be reused in several views, element names can remain consistent, and validation rules can detect missing descriptions or references.
workspace "Praebere" "Educational example" {
    model {
        creator = person "Creator" "Creates presentations"
        ai = softwareSystem "AI Assistant" "External system"

        praebere = softwareSystem "Praebere" {
            web = container "Web Editor" "Edits and animates" "Angular"
            store = container "Project Store" "Persists projects" "IndexedDB"
            media = container "Media Engine" "Exports video" "WebAssembly"
        }

        creator -> web "Creates presentations using" "HTTPS"
        web -> store "Reads and writes projects" "IndexedDB API"
        web -> media "Requests rendering" "Web Worker messages"
        web -> ai "Requests suggestions when enabled" "MCP/HTTP"
    }

    views {
        systemContext praebere "Context" { include *; autoLayout lr }
        container praebere "Containers" { include *; autoLayout lr }
    }
}11.2 Diagramming versus modeling
In a drawing tool, every box and arrow is primarily a graphical object. In a modeling tool, the graphical box visualizes a reusable semantic element. Modeling improves consistency and navigation, but requires discipline in defining identities, relationships, and properties. High-quality diagrams can be produced with either approach; the difference becomes most visible when documentation grows and must be maintained at scale.
11.3 Automatic layout and human review
Automatic layout reduces mechanical work but does not fully understand narrative. An algorithm can minimize line crossings while placing the most important element in a confusing position. A human reviewer must evaluate reading direction, grouping, proximity, alignment, whitespace, visual hierarchy, and whether the main story can be understood in seconds.
12. Governance, maintenance, and automation
12.1 Source of truth
Define where the official model lives, who maintains it, and how changes are approved. Avoid uncontrolled copies in presentations, wikis, file shares, and repositories with no indication of authority. Exported images can be distributed widely, but they should point back to the source model and include a generation date or version.
12.2 Versioning and review
Diagrams as code can follow pull requests, peer review, branching, and history. Significant architecture changes should update the model, ADRs, operational documentation, security records, and tests where applicable. Visual tools need an equivalent review process and reliable version history. Review criteria should address semantic correctness, not only visual appearance.
12.3 Different rates of change by level
Context changes slowly, containers change at a moderate pace, components change with refactoring, and code changes rapidly. This difference justifies distinct strategies: periodic human review at high levels and automated generation or validation at low levels. The official FAQ mentions potential sources such as service catalogs for landscape and context views, telemetry for relationships between services, static analysis for components, and infrastructure-as-code for deployment [19].
12.4 Architectural Definition of Done
- Affected views have been updated.
- New relationships have meaningful labels and relevant protocols.
- ADRs have been created or linked when a significant decision was made.
- Runbooks, dashboards, repositories, and ownership are connected to relevant elements.
- Someone outside the change has reviewed the documentation.
- Removed elements no longer remain in obsolete or misleading views.
- Planned and current-state elements are visually distinguished.
12.5 Measuring usefulness
Quality should not be measured by the number of diagrams. More useful signals include onboarding time, recurring questions, speed of architecture review, ability to locate ownership, reduction of disagreement between teams, and the time required to assess the impact of a change. These are qualitative and operational indicators rather than a universal mathematical formula.
13. Limitations, risks, and antipatterns
13.1 C4 is not a design process
The levels do not prescribe that analysts create context views, architects create containers, and developers create components. C4 describes software; it does not define roles, phases, delivery methods, or governance structures. It can be used before implementation, retrospectively, or continuously [2].
13.2 C4 does not cover every architectural dimension
Its main focus is static structure at several abstraction levels. Business processes, detailed data models, states, algorithms, quality requirements, costs, policies, and decisions require complementary artifacts. Dynamic and Deployment diagrams expand the scope, but they do not form a complete language for every architectural phenomenon.
13.3 Excessive diagrams
Creating a view for every module, endpoint, and environment produces expensive documentation that few people consult. The criterion should be value: a view exists to answer a recurring question, support a decision, reduce risk, enable operation, or teach a complex part of the system.
13.4 Mixing abstractions
A drawing that places "Customer", "Kubernetes", "OrderService class", "Oracle Database", and "Team X" at the same level mixes a person, infrastructure, code, container, and organization. The remedy is usually to separate views and declare element types. A custom mixed view is acceptable only when the question genuinely requires it and the legend makes the semantics explicit.
13.5 False rigor
Adopting colors, templates, and naming conventions does not guarantee quality. A perfectly aligned diagram can still contain incorrect boundaries, vague relationships, fictitious responsibilities, and obsolete technology. Rigor comes from correspondence with reality, consistency across views, traceability to decisions, and the ability to support useful conversations.
13.6 Outdated documentation
An incorrect diagram may be worse than no diagram because it creates unjustified confidence. Record the date, source, owner, and status: current, planned, legacy, experimental, or hypothesis. Automate what changes rapidly and review what depends on interpretation. Documentation without an owner and update trigger should be treated as a temporary artifact, not as a reliable map.
| Antipattern | Symptom | Treatment |
|---|---|---|
| Container equals Docker | Every pod becomes a C4 container | Model applications and data stores; leave pods for deployment views |
| Component equals package | Hundreds of boxes without responsibilities | Group by capability and interface |
| One view for everything | A giant and unreadable diagram | Create filtered views around explicit questions |
| Arrow labeled "uses" | Integration has no clear direction or protocol | Specify the verb, data, and technology |
| C4 as complete architecture | Decisions, qualities, and risks are missing | Combine C4 with ADRs, requirements, and other views |
| Diagram without an owner | The document silently becomes obsolete | Define a source of truth, review process, and automation |
14. Case study: Praebere
This case study demonstrates the progression of C4 views using Praebere, a presentation and visual-flow creation tool. The architecture is deliberately simplified and illustrative. Its purpose is to show how the same model can answer different questions without mixing abstraction levels.
14.1 Assumptions of the example
- Praebere is treated as one software system focused on creating animated presentations and exporting them as video.
- The main editing experience runs in an Angular single-page application.
- Project data can be persisted locally through browser storage or files.
- A media engine performs rendering, audio composition, and encoding through browser APIs, workers, or WebAssembly.
- An optional automation connector can receive validated commands from an AI assistant through MCP or IPC.
- External media catalogs, video platforms, and identity providers are outside the Praebere system boundary.
14.2 System Landscape
The landscape positions Praebere within a broader ecosystem. Creators use the product, AI assistants may provide authorized suggestions, media catalogs supply licensed assets, video platforms receive exported content, and an identity provider may authenticate users. No single internal application is shown because the purpose is organizational and ecosystem-level orientation.
14.3 System Context Diagram
The context view narrows the story to Praebere as the system in focus. It identifies the presentation creator, the audience that eventually consumes published material, the AI assistant, media providers, and the video platform. The diagram answers who uses the system and which external dependencies matter, without revealing Angular, IndexedDB, WebAssembly, or internal modules.
14.4 Container Diagram
The container view opens the Praebere boundary. The Web Editor provides the interactive experience; Project Storage persists projects and metadata; the Media Engine renders and encodes output; and the optional Automation Connector translates authorized structured commands into editor actions. Relationships include relevant communication mechanisms, while infrastructure details such as CDN, browser processes, or replicas remain outside this view.
The diagram also demonstrates why "container" is broader than a Docker container. IndexedDB is a data store, the Angular SPA is an executable application, and the media engine may run through a Web Worker or WebAssembly inside the user device. All are valid C4 containers because they are executable or storage building blocks of the software system.
14.5 Component Diagram
The component view opens only the Web Editor. Application Shell owns navigation and session commands; Board Editor manipulates visual elements; Scene Model maintains the semantic structure; Animation Orchestrator calculates timing and camera movement; Asset Manager manages media; Export Coordinator coordinates output; and Project Repository Adapter hides persistence details. They run inside one container and are not independently deployed services.
This view is valuable because it explains internal responsibilities without listing every Angular component, TypeScript class, or utility file. It should remain at a level where architectural boundaries, interfaces, and change impact are visible.
14.6 Code Diagram
The code view selects a few classes and one interface to explain coordination, persistence, and dependency inversion. PresentationFacade coordinates use cases, SceneService owns scene operations, AnimationService produces the timeline, ExportService renders output, and ProjectRepository separates the domain-facing contract from the IndexedDB implementation. It deliberately omits most properties and framework details.
In real documentation, this view should be generated or reviewed close to the code because class and function relationships change more quickly than system and container boundaries.
14.7 Dynamic Diagram
The numbered interactions make runtime order explicit. The creator requests an export; the shell starts the operation; the coordinator obtains scene snapshots and a timeline; the media engine receives scenes, timing, and audio; and the resulting video file is made available. A more detailed view could add progress reporting, chunking, cancellation, retries, and failure handling, but those details should appear only when they are relevant to the decision being discussed.
14.8 Deployment Diagram
The deployment view separates hosting infrastructure from execution on the user device. Static artifacts are distributed through DNS/CDN and hosting, but the Angular application instance runs in the browser. IndexedDB and the media worker also exist on the device. This explains a major architectural characteristic: a substantial part of processing and persistence can occur on the client rather than on a central backend.
A future desktop edition, collaboration backend, rendering service, or cloud project store would require additional deployment nodes and container instances. Those changes should be introduced into the model only when they become real or clearly marked target-state architecture.
14.9 What the complete set of views allows us to conclude
- The landscape places the product in a broader ecosystem.
- The context explains value and external dependencies without exposing implementation.
- The container view reveals that the solution can operate primarily on the client.
- The component view distributes internal responsibilities of the editor.
- The code view illustrates a design decision without documenting the entire codebase.
- The dynamic view teaches the export sequence and runtime collaboration.
- The deployment view explains where processing and persistence occur.
15. Review checklist
The checklist below adapts official recommendations and adds maintenance and consistency concerns. It can be used during pull requests, workshops, onboarding reviews, architecture boards, and security assessments.
| Area | Review question |
|---|---|
| Purpose | Is the question answered by the view explicit? |
| Title | Are the diagram type, scope, and environment included in the title? |
| Audience | Is the level of detail appropriate for the intended reader? |
| Abstractions | Does every element declare or clearly imply its C4 type? |
| Responsibilities | Do names and descriptions explain what each element does? |
| Technologies | Do containers, components, and relationships show technology only when useful? |
| Relationships | Does every important arrow have a coherent direction and label? |
| Boundaries | Are ownership, system scope, trust zones, and environments visually clear? |
| Legend | Are colors, shapes, lines, icons, acronyms, and perspectives explained? |
| Consistency | Do the same elements retain consistent names across views? |
| Scale | Is the view filtered enough to remain readable? |
| Reality | Does the diagram match the current implementation, or is it marked as future state? |
| Decisions | Are relevant ADRs or justifications linked? |
| Operations | Are ownership, runbooks, SLOs, or dashboards accessible when needed? |
| Maintenance | Is there an owner, source of truth, and update trigger? |
| Accessibility | Can the diagram be understood without relying only on color or tiny text? |
16. Conclusion and advice to the reader
The C4 Model organizes architecture communication through a simple hierarchy: software systems, containers, components, and code. The four central diagrams use progressive zoom to tell stories suited to different audiences. System Landscape, Dynamic, and Deployment views extend the approach to organizational ecosystems, runtime collaboration, and execution infrastructure.
The strength of C4 is not found in colors or templates. It lies in making element types, scope, responsibilities, relationship directions, and audience explicit. It brings the map closer to implementation without requiring every participant to master a large visual language. At the same time, it does not replace architectural decisions, quality requirements, domain models, data models, business processes, states, security analysis, or operational documentation.
In my view, C4 offers one of the best trade-offs between simplicity and usefulness for software teams. Context and container views should exist for almost every significant system. Component, code, dynamic, and deployment views should be created selectively and driven by questions. The worst adoption is bureaucratic: producing every level because a template demands it. The best adoption is conversational: using the model to expose ambiguity, align teams, evaluate risk, and maintain a trustworthy map of the software.
The practical recommendation is to start small. Choose a real system, draw its context, open it into containers, and show the views to someone who does not know the solution. That person's questions will reveal the next useful level of detail. The ultimate objective is not to accumulate more diagrams; it is to reduce the distance between what the system is, what the team believes it is, and what the organization can explain clearly.
Glossary
| Term | Definition |
|---|---|
| C4 Model | Architecture visualization approach based on hierarchical abstractions and views. |
| C4 Modeling | The activity of modeling elements, relationships, properties, and views using C4. |
| C4 Diagrams | Diagrams generated from the model: Context, Container, Component, Code, and supporting views. |
| Person | A human role, persona, group, or actor that interacts with a software system. |
| Software System | A software solution that delivers value and has a responsibility boundary. |
| Container | An executable application or data store; it does not necessarily mean Docker. |
| Component | A cohesive grouping of functionality inside a container, encapsulated behind an interface. |
| Code Element | An implementation element such as a class, interface, function, object, module, or table. |
| View | A selection of model content designed to answer a question or serve an audience. |
| Deployment Node | A physical, virtual, PaaS, runtime, or device location where instances execute. |
| Perspective | Cross-cutting information such as security, criticality, ownership, or data classification. |
| Model as Code | Definition of a semantic architecture model in a versionable and automatable textual language. |
| Diagram as Code | Generation of a drawing through code; it may or may not use a reusable semantic model. |
References
- [1] C4 Model. Home - The C4 model for visualising software architecture. https://c4model.com/
- [2] C4 Model. Frequently asked questions - background, history, and integrations. https://c4model.com/faq
- [3] C4 Model. Abstractions. https://c4model.com/abstractions
- [4] C4 Model. Diagrams. https://c4model.com/diagrams
- [5] C4 Model. Container diagram. https://c4model.com/diagrams/container
- [6] C4 Model. Component and Component diagram. https://c4model.com/abstractions/component
- [7] C4 Model. Code diagram. https://c4model.com/diagrams/code
- [8] C4 Model. System context diagram. https://c4model.com/diagrams/system-context
- [9] C4 Model. System landscape diagram. https://c4model.com/diagrams/system-landscape
- [10] C4 Model. Dynamic diagram. https://c4model.com/diagrams/dynamic
- [11] C4 Model. Deployment diagram. https://c4model.com/diagrams/deployment
- [12] C4 Model. Notation. https://c4model.com/diagrams/notation
- [13] C4 Model. Software architecture diagram review checklist and diagram FAQ. https://c4model.com/diagrams/checklist
- [14] KRUCHTEN, Philippe. Architectural Blueprints - The 4+1 View Model of Software Architecture. IEEE Software, 1995. https://arxiv.org/abs/2006.04975
- [15] OBJECT MANAGEMENT GROUP. Unified Modeling Language (UML). https://www.omg.org/uml/
- [16] BROWN, Simon. The C4 Model: Visualizing Software Architecture. O'Reilly Media, June 2026. https://www.oreilly.com/library/view/the-c4-model/9798341660113/
- [17] ISO/IEC/IEEE 42010:2022. Software, systems and enterprise - Architecture description. https://www.iso.org/standard/74393.html
- [18] C4 Model. Software system abstraction. https://c4model.com/abstractions/software-system
- [19] C4 Model. Diagrams FAQ - updates and automation. https://c4model.com/diagrams/faq
- [20] C4 Model. Queues and topics. https://c4model.com/abstractions/queues-and-topics
- [21] Structurizr. Why "as code"? and DSL documentation. https://docs.structurizr.com/as-code
Web references were accessed on July 17, 2026. The Praebere case-study figures were produced specifically for this article and do not reproduce the official C4 examples.
Create the visual journey
Turn your process into a presentation
Build the diagram, choose the sequence, add narration or webcam video, and preview the camera movement in your browser.
Open Praebere