
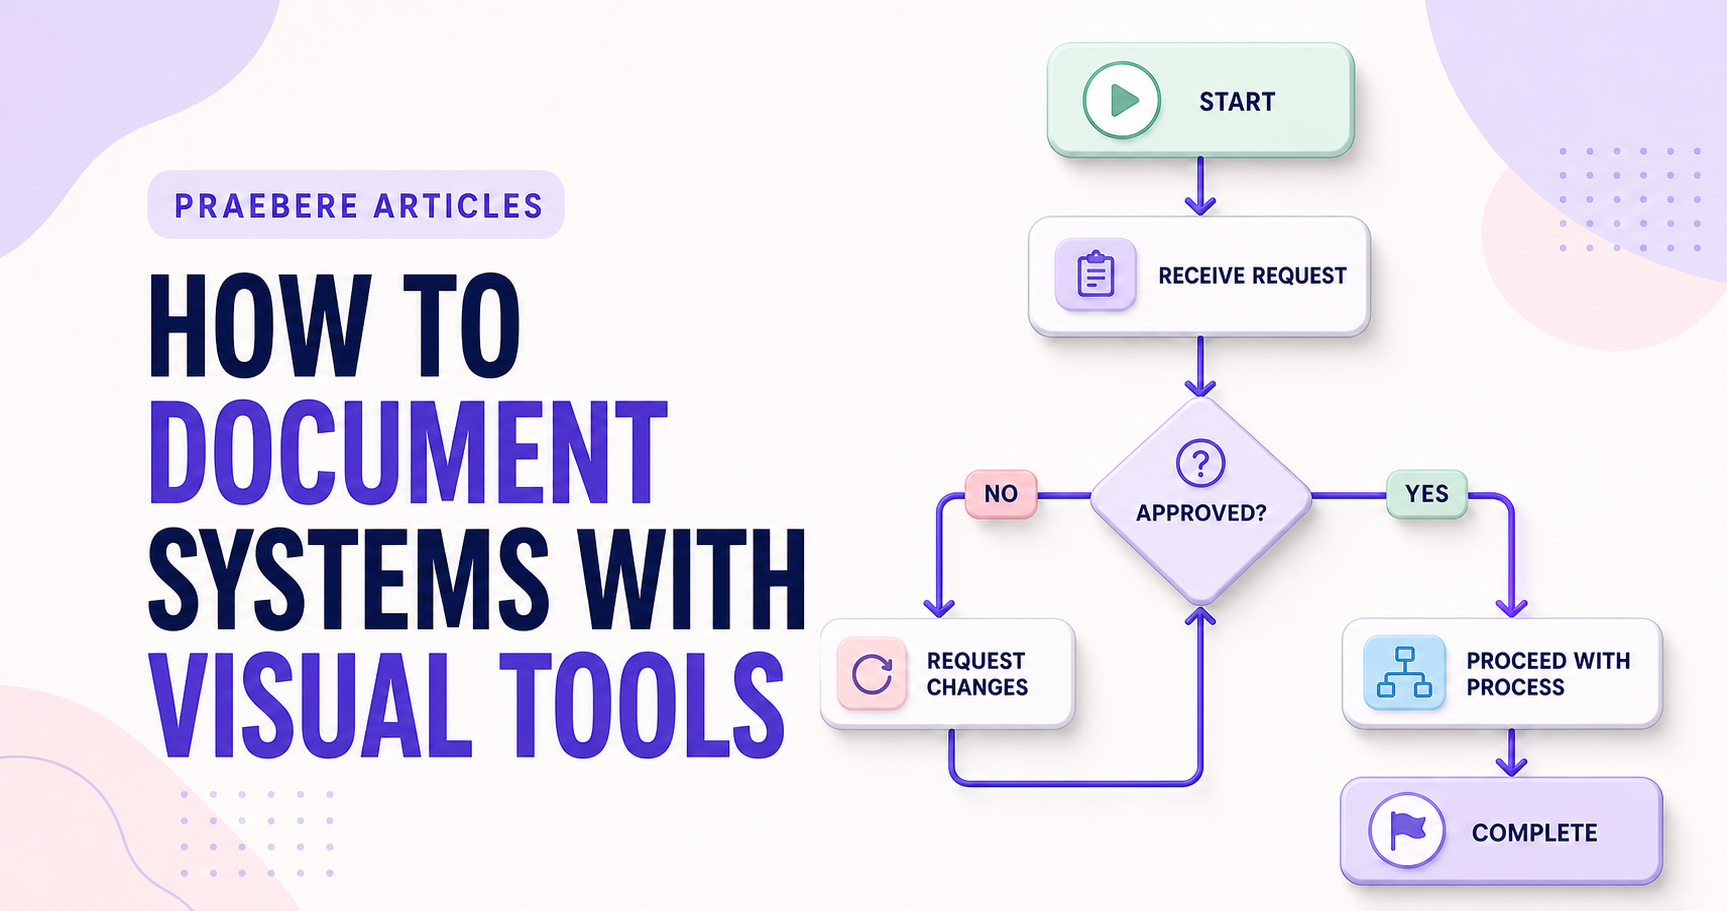
The practical decisions behind “How to Document Systems With Visual Tools”
A polished result is only the visible surface of “How to Document Systems With Visual Tools”; underneath it sits the challenge framed by “Create the minimum useful set of views.” Choose a view for a specific architectural question.
The practical challenge begins when general advice meets real content, real constraints, and a real audience. Which architectural question must the visual answer, and what level of detail belongs in that view? How can boundaries, runtime behavior, failures, and source-of-truth documentation remain connected without turning the diagram into an unreadable inventory? The sections ahead use these questions to move from the central idea to concrete decisions, technical criteria, and an applied example.
Create the minimum useful set of views
Document system context, main responsibilities, critical data or interactions, deployment, and operational dependencies. Add decision records and runbooks beside diagrams rather than forcing every explanation into the canvas.
Define the audience and scope on each page. A dated boundary around “payments platform” is more trustworthy than a polished diagram whose coverage is unknown.
Make maintenance part of delivery
Store sources where teams can find and version them, assign owners, link relevant code or specifications, and create review triggers for releases or architectural decisions. Prefer reproducible formats and accessible exports.
Use presentations for guided explanation and authoritative documentation for continuing reference. Praebere can communicate a visual walkthrough, but the maintained source set must remain the system record.
Make documentation reviewable and operationally useful
Prefer source formats that can be versioned, reviewed, searched, and reproduced. Store the diagram definition, exported accessible view, scope, owner, and links to code, API contracts, data definitions, decision records, runbooks, and threat models. Generated diagrams reduce manual drift, but they still need filtering and human explanation to become useful documentation.
Define change triggers: a new external dependency, service boundary, data classification, deployment topology, interface version, or recovery strategy should prompt review. Use documentation in onboarding, incident response, architecture review, and change planning; unused diagrams decay quickly. Provide text descriptions and structured tables for relationships that cannot be understood visually.
- Version source and generated output together
- Assign ownership and explicit review triggers
- Link diagrams to authoritative technical artifacts
- Test documentation during real onboarding and operations
Technical implementation notes
Choose a view for a specific architectural question. Document boundaries, responsibilities, interfaces, data ownership, trust zones, deployment, runtime communication, and failure propagation without mixing every abstraction level into one diagram.
Link the explanatory view to authoritative artifacts such as source repositories, API contracts, infrastructure definitions, decision records, and observability data. Add owner, version, scope, assumptions, and review triggers so readers can judge currency and confidence. The most relevant concepts here are visual system documentation, software documentation diagrams, document systems. Define them when first used and apply each term consistently to an observable element, rule, or outcome.
- Viewpoint and abstraction level are named
- Dependencies show direction and protocol
- Data and trust boundaries are visible
- Diagram links to current technical sources
Worked example: How to Document Systems With Visual Tools
Consider an online checkout that calls an API gateway, order service, payment provider, inventory service, and message queue. Start with a context view for business stakeholders, then add a container or component view for ownership and a sequence view for the successful request plus timeout and retry paths.
Label protocols, synchronous and asynchronous calls, data ownership, authentication boundary, timeout, retry limit, and responsible team. Link the API interaction to the OpenAPI contract and the deployment view to infrastructure definitions so the explanation can be checked against the running system.
Conclusion
The path through create the minimum useful set of views, make maintenance part of delivery, and make documentation reviewable and operationally useful brings the article back to one practical concern: how “How to Document Systems With Visual Tools” behaves outside an ideal example. The technical checks and worked scenario turn the guidance into something a reader can evaluate and apply.
For us, the idea reaches its most useful conclusion here: an architecture visual earns trust through a clear viewpoint, explicit boundaries, traceable sources, and regular maintenance. Showing fewer current and relevant details is better than publishing an exhaustive diagram that no longer matches the system.
Create the visual journey
Turn your process into a presentation
Build the diagram, choose the sequence, add narration or webcam video, and preview the camera movement in your browser.
Open Praebere