
A closer look at the decisions behind “Velocity, Cycle Time, and Throughput”
The visible choices in “Velocity, Cycle Time, and Throughput” grow from the earlier decision described by “The measures answer different operational questions.” Start with the analytical question, unit of analysis, metric definition, denominator, time window, baseline, and comparison.
The practical challenge begins when general advice meets real content, real constraints, and a real audience. What decision should this measure improve, how is it defined, and which behavior could change once it becomes a target? Does the evidence describe delivery capability, product value, quality, or only a convenient count of activity? The sections ahead use these questions to move from the central idea to concrete decisions, technical criteria, and an applied example.
The measures answer different operational questions
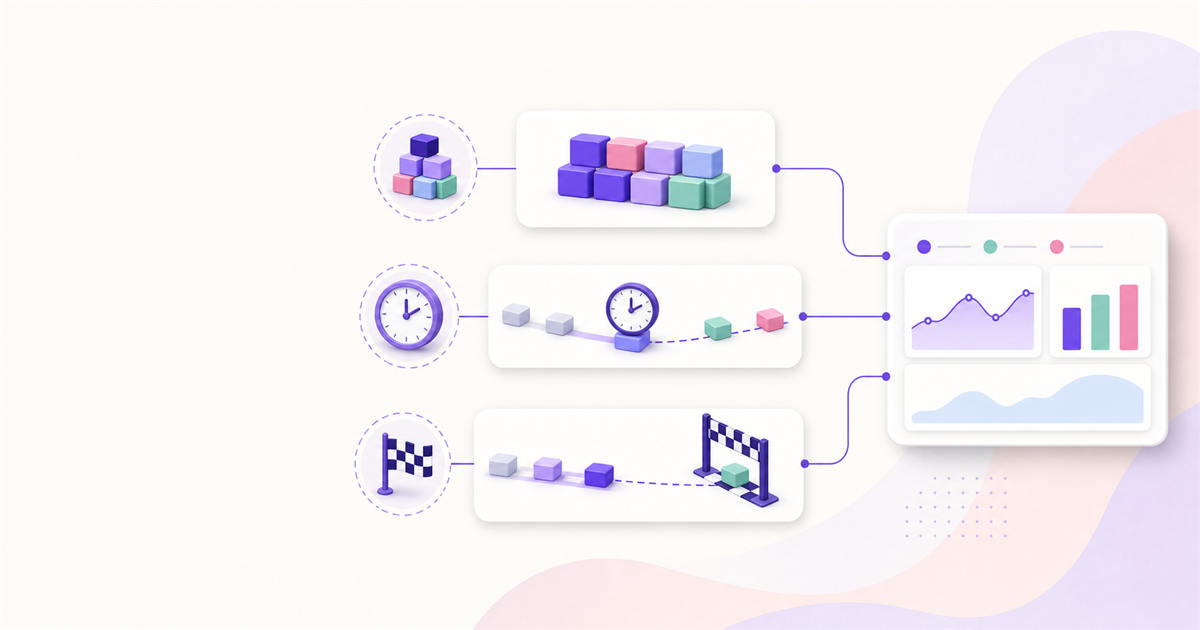
Velocity summarizes estimated size completed by a team during a period. Throughput counts completed work items during a period. Cycle time measures elapsed time from a defined start point to a defined finish point for one item.
These measures are not interchangeable. Before graphing them, define the decision: selecting a reasonable Sprint forecast, understanding completion rate, or estimating how long a similar item might take.
Stable definitions matter more than sophisticated charts
Velocity depends on a team’s relative estimation scale and Definition of Done. Throughput depends on what counts as one item and when it counts as complete. Cycle time depends on exact workflow boundaries and how blocked or waiting time is treated.
Segment data when work types differ materially. A production incident, small experiment, and large product capability should not silently share one distribution if the audience will infer that they are comparable.
- Publish start and finish rules for cycle time.
- Count only work meeting the stated completion condition.
- Show distributions or ranges, not only averages.
- Record policy changes that break historical comparability.
Choose visuals that preserve variation
A trend can show throughput by Sprint, while a scatterplot or histogram can reveal the distribution of cycle times. Percentiles often support more realistic service expectations than a single mean distorted by a few very old items.
Velocity charts should remain local planning aids and retain the estimation context. Avoid dashboards that rank teams or use color thresholds without explaining what decision each threshold supports.
Pair delivery capability with product outcomes and quality
Faster completion can produce more low-value output. Inspect customer outcomes, Sprint and Product Goals, defects, reliability, and feedback alongside flow measures to understand whether speed contributes to useful value.
Use metrics to start investigation, not to replace conversation. When a value changes, examine work mix, policies, dependencies, quality, and product conditions before attributing the result to team effort.
Technical implementation notes
Start with the analytical question, unit of analysis, metric definition, denominator, time window, baseline, and comparison. Choose the visual encoding that matches the task: position for precise comparison, length for magnitude, slope for change, and area only when area genuinely represents quantity.
Keep axes, scales, units, filters, sample size, source, and uncertainty visible. Recalculate important values, inspect outliers, avoid truncated axes that exaggerate small changes, and distinguish correlation, attribution, forecast, and target from measured results. The most relevant concepts here are velocity cycle time throughput, Scrum metrics, agile flow metrics. Define them when first used and apply each term consistently to an observable element, rule, or outcome.
- Metric and denominator are defined
- Scale and baseline do not distort the pattern
- Source, period, filters, and uncertainty are disclosed
- Annotation explains the decision-relevant pattern
Worked example: Velocity, Cycle Time, and Throughput
Suppose a team completed 32 story points, 11 backlog items, and recorded a median cycle time of 4.5 days. Define how each value was produced before comparing periods: the point scale is local, throughput depends on item boundaries, and cycle time depends on explicit start and finish states.
Place these delivery signals beside Sprint Goal achievement, defects, customer behavior, and the distribution rather than only the average. If velocity rises while recovery failures and cycle-time variation also rise, the dashboard should trigger investigation instead of declaring improved performance.
Conclusion
The path through the measures answer different operational questions, stable definitions matter more than sophisticated charts, choose visuals that preserve variation, and pair delivery capability with product outcomes and quality brings the article back to one practical concern: how “Velocity, Cycle Time, and Throughput” behaves outside an ideal example. The technical checks and worked scenario turn the guidance into something a reader can evaluate and apply.
The strongest takeaway, in our opinion, is that Scrum metrics should improve a defined planning or product decision, not become proxies for individual productivity or team value. Measures need stable definitions, visible variation, and product outcomes beside them to support responsible interpretation.
Create the visual journey
Turn your process into a presentation
Build the diagram, choose the sequence, add narration or webcam video, and preview the camera movement in your browser.
Open Praebere