
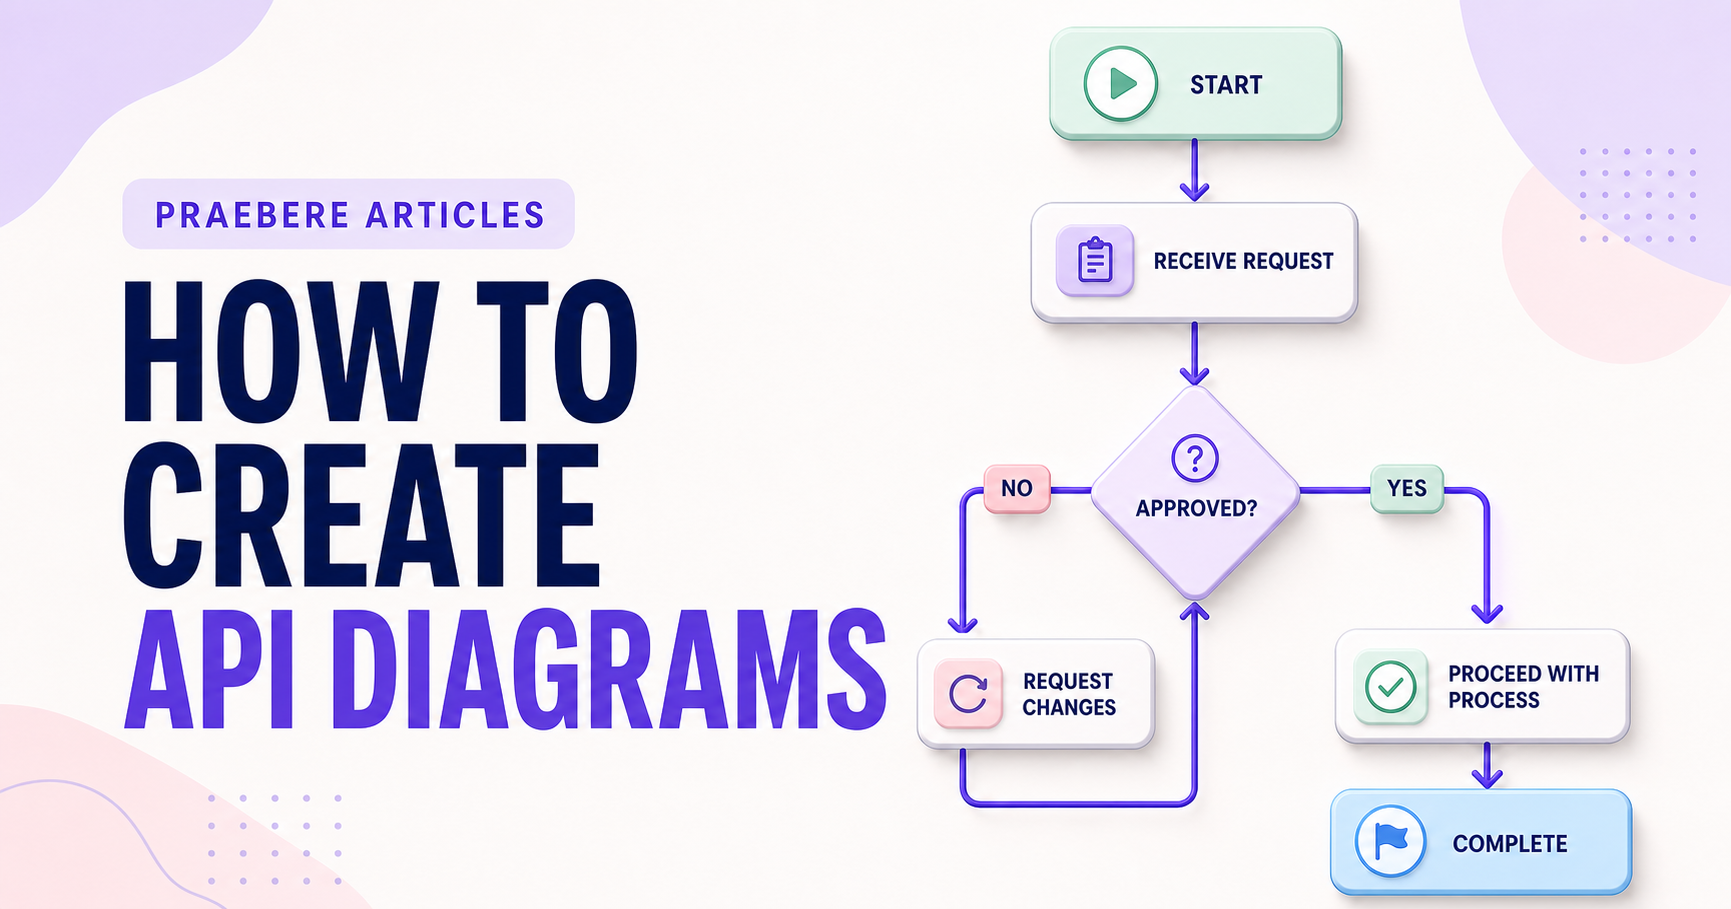
The practical decisions behind “How to Create API Diagrams”
A reader can understand “How to Create API Diagrams” more clearly by first looking at “Choose the API view your audience needs.” Choose a view for a specific architectural question.
The practical challenge begins when general advice meets real content, real constraints, and a real audience. Which architectural question must the visual answer, and what level of detail belongs in that view? How can boundaries, runtime behavior, failures, and source-of-truth documentation remain connected without turning the diagram into an unreadable inventory? The sections ahead use these questions to move from the central idea to concrete decisions, technical criteria, and an applied example.
Choose the API view your audience needs
A landscape view shows producers, consumers, gateways, and external services. A sequence view explains one request over time. A data model view clarifies key entities, while a lifecycle view shows authentication, retries, and asynchronous work.
Use names that match the formal API specification. Label direction, protocol, authentication, and important data without turning the diagram into a copy of every endpoint.
Show contracts and failure behavior
Include validation, rate limits, pagination, idempotency, timeouts, error responses, and eventual consistency where they affect the scenario. Mark personal or sensitive data and the boundaries where authorization is enforced.
Link diagrams to OpenAPI or other authoritative documentation and version them together. A diagram explains the system; the machine-readable contract defines the interface.
Link explanatory diagrams to specifications and runtime evidence
Use an OpenAPI document or another machine-readable contract as the authority for HTTP operations, parameters, schemas, responses, and security schemes. The visual view should summarize boundaries and scenarios, then link to the exact contract version rather than manually reproducing every endpoint. Validate examples against the schema and keep production URLs and secrets out of public diagrams.
Add a sequence for authentication, a normal request, and at least one failure or asynchronous path. Show gateways, caches, queues, webhooks, retries, rate limits, idempotency, and ownership where relevant. Runtime traces can reveal calls and latency that the intended design missed; compare those observations with the diagram during reviews.
- Use a formal API specification as the source of truth
- Show authentication, errors, limits, and asynchronous behavior
- Label data classification and trust boundaries
- Version diagrams with contracts and verify them against traces
Technical implementation notes
Choose a view for a specific architectural question. Document boundaries, responsibilities, interfaces, data ownership, trust zones, deployment, runtime communication, and failure propagation without mixing every abstraction level into one diagram.
Link the explanatory view to authoritative artifacts such as source repositories, API contracts, infrastructure definitions, decision records, and observability data. Add owner, version, scope, assumptions, and review triggers so readers can judge currency and confidence. The most relevant concepts here are API diagram, API architecture diagram, visualize APIs. Define them when first used and apply each term consistently to an observable element, rule, or outcome.
- Viewpoint and abstraction level are named
- Dependencies show direction and protocol
- Data and trust boundaries are visible
- Diagram links to current technical sources
Worked example: How to Create API Diagrams
Consider an online checkout that calls an API gateway, order service, payment provider, inventory service, and message queue. Start with a context view for business stakeholders, then add a container or component view for ownership and a sequence view for the successful request plus timeout and retry paths.
Label protocols, synchronous and asynchronous calls, data ownership, authentication boundary, timeout, retry limit, and responsible team. Link the API interaction to the OpenAPI contract and the deployment view to infrastructure definitions so the explanation can be checked against the running system.
Conclusion
Rather than reducing “How to Create API Diagrams” to a checklist, the article linked choose the api view your audience needs, show contracts and failure behavior, and link explanatory diagrams to specifications and runtime evidence. That combination explains not only what to do, but also why the choices matter and how to inspect the outcome.
In our view, an architecture visual earns trust through a clear viewpoint, explicit boundaries, traceable sources, and regular maintenance. Showing fewer current and relevant details is better than publishing an exhaustive diagram that no longer matches the system.
Create the visual journey
Turn your process into a presentation
Build the diagram, choose the sequence, add narration or webcam video, and preview the camera movement in your browser.
Open Praebere